Content pages on an ecommerce website play an important role in reaching consumers: they bring them to your site, tell them who you are as a brand, and let them know what you can do for them. However, at the end of the day, the goal of a business’ ecommerce site is to sell a product. Is the only purpose of a content page to reach and teach consumers about a brand? Read on as we explore the customer journey on an ecommerce site, and how we can measure content page performance in driving purchase intent.
Educated and Uneducated Visitors
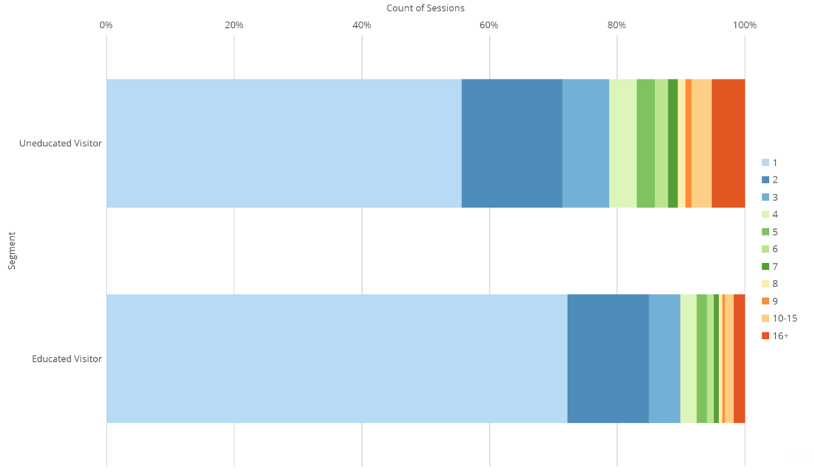
Every content page is different. Some pages are meant to educate visitors about who your brand is and what you do. Others seek to assist consumers in choosing the best product. However, no matter the type of content page, the goal is always to drive a purchase. One of the key indicators that tells us how likely a visitor is to buy a product is the number of times a user came to the site. At a high level, we can use this metric to measure the performance of all content pages by creating segments called “educated” and “uneducated” users. Educated users are those who have, at some point in their journey, seen a content page, whereas uneducated users have not. Once we create these two user types, we can compare the count of sessions for each. The goal is to understand how well your content is engaging users and if they are helping to create brand loyalty.

In the chart, we can see that a larger percentage of Educated Visitors are concentrated in the lower count of sessions than Uneducated Visitors, telling us that our content pages are less likely to bring users back to our website. From here we can drill down and explore the data to see the specific content pages that do not bring visitors back to the site.
The educated and uneducated segmentation can be applied on a session level as well if we want to compare some classic engagement metrics like bounce rate and pages per session. To do this, we would create an educated visit in which the landing page is a content page, or an uneducated visit in which the landing page is not a content page. If you find that users are less likely to bounce when landing on a content page, you can readjust your advertising strategy and send more traffic to these pages.
Product Listing and Product Detail Pageviews as an Engagement Metric
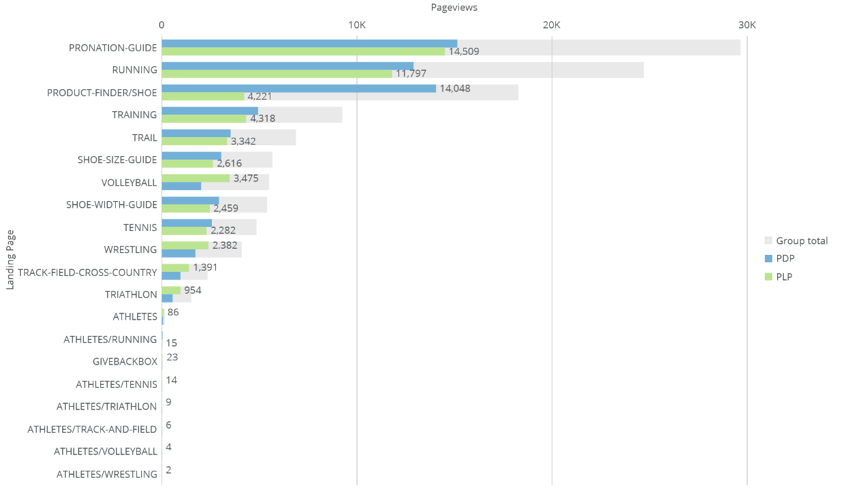
To identify specific top-performing and under-performing content pages, pageviews of Product Listing Pages (PLP) and Product Detail Pages (PDPs) can be used as an engagement metric. To do this, create a sequential segment, capturing those visits that land on a content page and, at some point in their session, also view a PLP or PDP. The number of PDP and PLP pageviews can then be totaled for all content pages, giving you a better understanding of which pages spark purchase intent and drive product pageviews.

Consider the chart above. In this case, we can see that users who landed on “Athletes/” pages are not very likely to go on to view product pages. By identifying this, we can then evaluate the goal, content, layout, and call to action of these pages and run tests or make adjustments to optimize them as necessary.
Similarly, you can trend these pageviews on a daily, weekly, or monthly basis, then filter them by channel or device type. If there are anomalies in the data, like a period with higher than average numbers, you can drill down to see exactly which pages are driving the pageviews.
Next Steps
Content pages are the framework of a brand’s ecommerce website. Without them, there would be limited opportunity to educate visitors and develop an ongoing relationship. While it can be difficult to quantify the direct impact these pages have on qualitative metrics like purchase intent, content pages are an essential part of your site. Leveraging the Google analytics API and guided reports in a Business Intelligence dashboarding tool like Domo, you can surface and streamline insights about your content pages. If you have any additional questions, or would like support measuring content page performance, please reach out to us.
