Haven’t caught up on the last Domo Blog? Catch the first post of the series here.
If you ever had to measure your brand’s social media performance or gather social media data to optimize your online marketing strategy, this blog post is for you. In this two-part blog series, we will be showing you how to use DOMO to automate your social reporting so you never have to spend hours sifting through cumbersome reports again!
Using DOMO to Automate Your Social Media
Part 1: Building the Dataset
The amount of data available from Facebook, Instagram, and Twitter is amazing, but let’s face it, exporting countless rows of data and making sense of it all can be a time-consuming task. Fortunately, I’ve developed a way to surface the most important insights in the form a versatile Domo card I like to call the Social Data Cube. The Social Data Cube allows you to surface any metric, campaign post, or dimension from any social account in a matter of a few clicks. In this first installment of my two-part blog series, I will show you how to transform and combine data from your Facebook, Instagram, and Twitter to power this amazing visualization.
Step 1: Collect Your Data
1. Run the following reports for each of your social accounts:
- Facebook: Page Post Lifetime Metrics, Page Posts
- Instagram: User's Recent Media
- Twitter: User Timeline
2. In each of the above reports, retrieve data from the beginning of the previous quarter to date and set the connector to update and append daily.
- Note: The Twitter connector only allows you to pull data up to 90 days in the past
Step 2A : Join Facebook Page Posts Dataset with Lifetime Metrics Dataset
1. Create and name a new Magic ETL Dataflow.
2. Append all Page Post Datasets.
- If you are pulling data from more than one Facebook account, I would recommend creating separate datasets for each account and using the Append Rows tile to create a union in Magic ETL. You can skip this step if you are only using a single account.
3. Clean your data.
- Use the Select Columns tile to keep and rename the following columns:
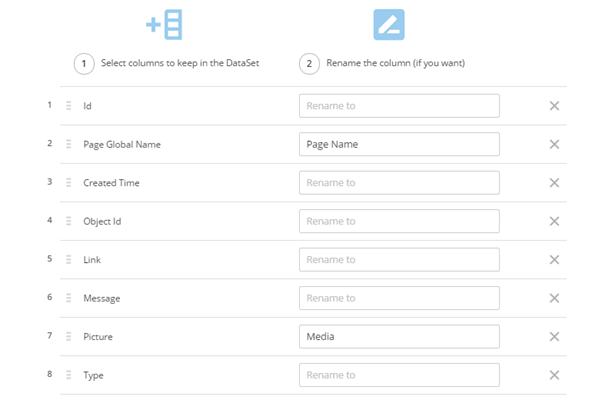
4. Create a second workflow stream to Input your Lifetime Metrics and clean your data.
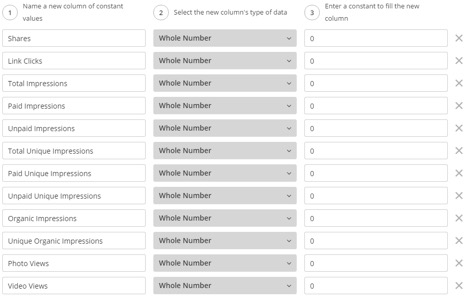
-
Use the Input Dataset tile to bring in your Page Post Lifetime Metrics dataset and use the Select Columns tile to keep and rename the following columns (you can keep any other columns of interest):
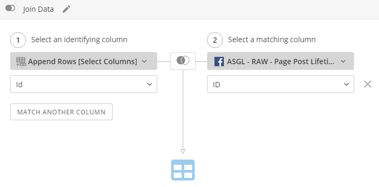
5. Join Page Posts and Lifetime Page Post Metrics.
- Use the Join Data tile to create a Left Outer join and configure:
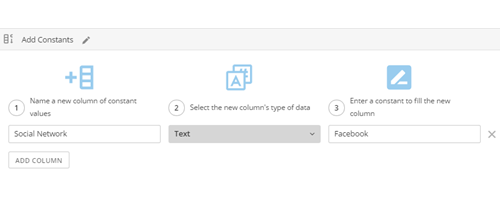
6. Add a `Social Network` Column to your dataset.
- Use the Add Constants tile to your workflow and configure:
Your workflow should now look something like this:
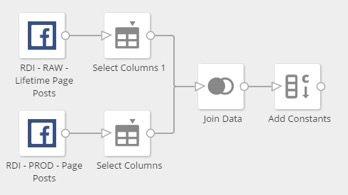
7. Create and name your Output Dataset, preview, and run!
STEP 2B: Combine Instagram Datasets and Data Preparation
1. Create and name a new Magic ETL Dataflow.
2. Append all User’s Recent Media Datasets.
- If you are pulling data from more than one Instagram account, I would recommend creating separate datasets for each account and using the Append Rows tile to create a union in Magic ETL. You can skip this step if you are only using a single accoun
3. Add a `Social Network` Column to your dataset.
- Use the Add Constants tile to your workflow and configure

4. Clean your data.
- Use the Select Columns tile to keep and rename the following columns
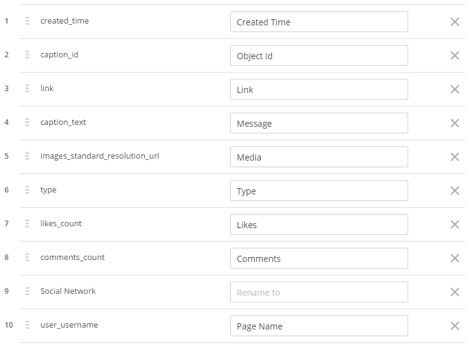
Your workflow should now look something like this:
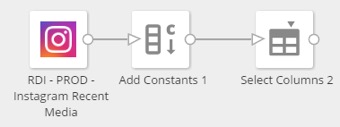
5. Create an Output Dataset, preview, and run!
STEP 2C: Combine Twitter Datasets and Data Preparation
1. Create and name a new Magic ETL Dataflow.
2. Append all User Timeline Datasets.
- If you are pulling data from more than one Twitter account, I would recommend creating separate datasets for each account and using the Append Rows tile to create a union in Magic ETL. You can skip this step if you are only using a single account.
3. Add a `Social Network` Column to your dataset.
- Use the Add Constants tile to your workflow and configure:

4. Clean your data.
- Use the Select Columns tile to keep and rename the following columns:
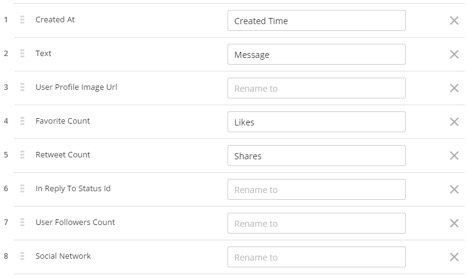
Your workflow should now look something like this:

5. Create an Output Dataset, preview, and run!
STEP 3: Putting It All Together
1. Create a new Magic ETL and input your Facebook, Instagram, and Twitter datasets.
2. Add dummy columns to your Instagram and Twitter datasets.
- Use the Add Constants tile to add the following columns and column values:

***Do not add a `Shares` column to Twitter.
Note: These columns are created to append to and support your larger Facebook dataset, which contains unique columns and values that are important to powering your card. Without this crucial step, you run the risk of compromising your data integrity when creating a Beast Mode on this output dataset.
3. Combine your Facebook, Instagram, and Twitter datasets.
- Use the Append Rows tile to create a union between all three datasets (see below for configuration example). Review the changes that will be made in Part 2 of the configuration menu to ensure no needed columns will be left out. If needed columns are being excluded, go back and check the transformations in your previous workflow and change your column names accordingly.
4. Optional: Select only the columns you want.
- Look through your data set in a preview and remove any columns you do not want included in your final dataset by using the Select Columns tile.
Your workflow should now look something like this:
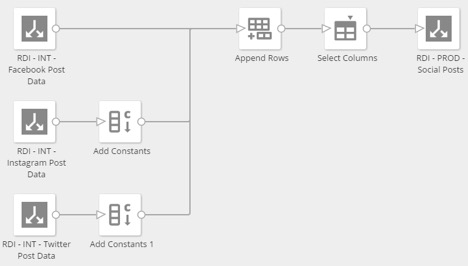
There you have it! All your social data should now be cleaned, transformed, and combined into one beautiful dataset. In my next blog, I will show you how to use this dataset to create the Social Data Cube, which will automatically surface the performance of your social media posts.
Follow the series and check out the next Domo blog here.
If this all seems like too much to handle, let us help you. Email questions@reddoor.biz to schedule a DOMO demo with our Analytics team, and see how we can help you leverage Domo to make game-changing business insights in your data.
